
With extensive experience in energy management and electricity delivery, Christopher Hailstone is an expert on the intricate challenges of grid reliability and security. We sat down with him to discuss a threat that is often overlooked in favor of headline-grabbing storms: the slow, corrosive financial impact of climate change on our utility infrastructure. Our conversation explored the concept of “silent derating,” the hard data that proves resilience is a sound investment rather than a cost, and the specific strategies utilities can use to build a stronger, more financially defensible grid for the future.
Many utilities prepare for catastrophic “1-in-100-year” events. How does the “silent derating” of grid assets from shifting weather baselines present a more immediate financial threat, and what specific operational costs does this create that fly under the radar?
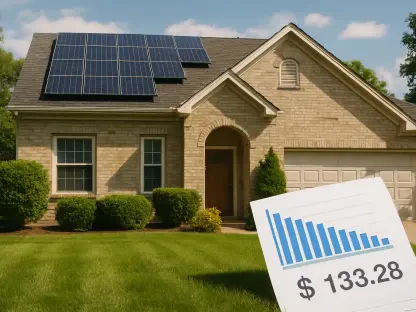
It’s a critical blind spot. While we absolutely need to plan for major hurricanes and freezes, the real financial drain is happening every day. We’re bleeding cash on the 1-in-5-year reality, not just the 1-in-100-year storm. This “silent derating” is the gradual erosion of asset performance because our fundamental assumption about weather is wrong. Most reliability models treat weather as static, as if an average day in 2030 will be the same as in 2000. But as heat and precipitation baselines shift, our equipment works less efficiently, fault rates climb, and operating expenditures quietly balloon. These are costs from minor outage repairs and efficiency losses that accumulate steadily, a constant financial drip that doesn’t make the news but absolutely impacts the bottom line long before a named storm ever forms.
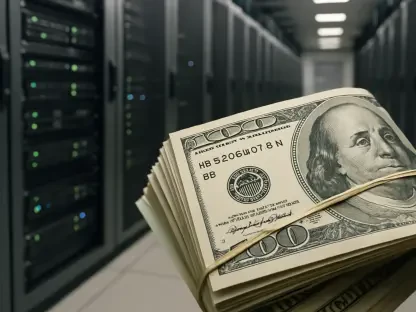
Analysis of a European grid portfolio showed significant value erosion by 2050 even under low-emissions scenarios. What does this “baked-in” risk mean for utility planners who might be delaying investments, and why is waiting for global policy not a viable strategy for local grid reliability?
It means that inaction is a financially dangerous gamble. In that analysis of a $1.5 billion portfolio, we saw that a “business as usual” emissions path threatens to erode over 30% of the portfolio’s value by 2050. But here’s the key finding: even in a best-case “climate protection” scenario, that value risk is still over 21%. The damage is already baked in. The hazards are coming regardless; the only difference is how steep the curve is and when the worst impacts arrive. We see operating expenditure losses climb much faster after the 2040s in the high-emissions scenario, but in both cases, the trajectory is undeniably upward. A utility planner simply cannot afford to wait for global mitigation efforts to solve a local reliability problem. That “climate tax” is going to be levied on their system one way or another.
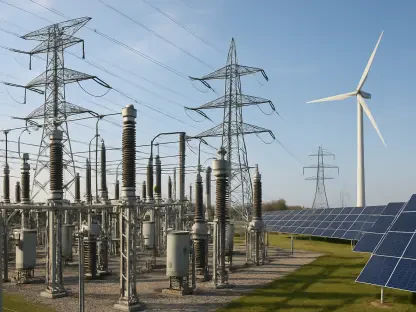
The nature of climate risk seems to differ by asset; for instance, overhead lines face chronic stress from precipitation while substations face catastrophic flood risk. Could you walk us through how you would quantify the “Average Annual Loss” for each, and how that data changes investment priorities?
Absolutely, the risks are not monolithic. For the 37,000 miles of overhead lines we analyzed, the primary threat wasn’t a single event but chronic, attritional stress. For that operator, heavy precipitation was the key trigger—damp, heavy air increases vegetation contact and causes conductors to clash, leading to more frequent faults. This is more of a conditions problem than a storm problem. We calculated that gross revenue losses from these hazards on unadapted lines could climb over 12,000% by 2050. The Average Annual Loss, or AAL, for these lines captures the operational costs of frequent restoration and energy-not-supplied penalties. For substations, the risk is concentrated. It’s not about frequency; it’s about the catastrophic capital damage from a single flood inundation event. By calculating the AAL for both, we can move beyond a generic “heat map” and see a clear financial picture: we need to address the high-frequency, low-cost events on the lines and the low-frequency, high-cost events at the substations.
You can make a strong business case for proactive resilience, such as hardening specific overhead lines. Could you describe the step-by-step process for identifying a “no-regret” upgrade and calculating its financial breakeven point, perhaps using an example?
This is where the data gets truly powerful. You start by moving past system-wide generalizations and looking at the performance of individual feeder segments. Using our AAL calculations, we can pinpoint which medium-voltage lines are most vulnerable to hazards like heavy precipitation. This isn’t about hardening everything; it’s about surgical precision. For a problematic 15 kV line, a “no-regret” move would be a targeted upgrade, like converting the bare conductors to semi-insulated compact conductors. It’s not a massive overhaul. Then, we calculate the financial payback. This isn’t based on surviving a hurricane; it’s based on the immediate, daily reduction in transient faults and the avoided penalties. In our analysis, these specific upgrades showed a financial breakeven point between year three and year five. It’s a clear, defensible investment that pays for itself quickly through improved operational reliability.
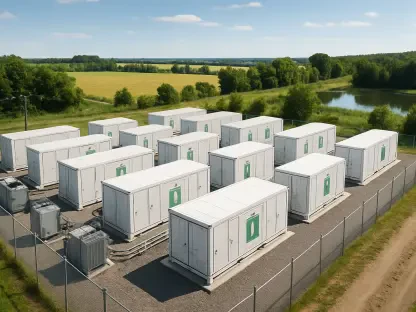
Flood-proofing a critical substation can be considered a defensive financial asset. What are the key data points needed to convince regulators and investors that an investment of over a million dollars in flood barriers has a defensible ROI with a six-year payback period?
To make that case, you need to speak the language of finance, not just engineering. First, you present the specific, quantified risk. Our modeling showed certain substations exposed to flood depths of 1 to 1.6 feet. Second, you present a concrete, cost-effective solution, such as raising foundations or installing deployable barriers, with a clear price tag—in this case, between about $180,000 and $1.4 million. The final, most crucial piece is the AAL calculation. By quantifying the massive financial loss—the equipment replacement, the extended outages, the economic disruption—avoided by preventing that flood, we can demonstrate the return on that investment. Our models showed a breakeven point around year six. At that point, the flood barrier is no longer a cost; it’s a defensive financial asset on the books, actively protecting capital and ensuring service continuity.
What is your forecast for grid resilience?
My forecast is that the conversation is fundamentally shifting. The era of treating climate adaptation as an unquantifiable “nice-to-have” or a post-storm surcharge is ending. Regulators and investors are getting smarter and are beginning to demand granular proof that capital plans are robust against future weather. Utilities that get ahead of this will stop viewing resilience as a cost center and start treating it as a prudent, data-driven investment strategy. We have the technology right now to quantify the Average Annual Loss on portfolios and calculate the specific payback period of a thicker cable or a higher flood wall. The forecast is for a stronger, smarter grid, but it will be built not just on concrete and steel, but on a financially defensive and operationally sound business case.