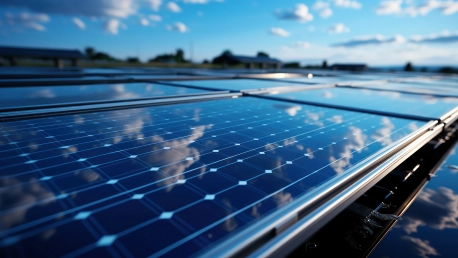
The landscape of global energy is witnessing a monumental shift towards renewables, with solar energy being a central piece of this transformation. The growth of solar photovoltaic (PV) installations in China, the European Union (EU), and the United States (U.S.) is indicative of this trend. Through an analysis of these key markets, we uncover the dynamics propelling solar energy to the forefront of the renewable energy revolution.
China’s Remarkable Growth in Solar Capacity
China’s Solar Industry Boom
China’s journey in solar energy is awe-inspiring, signaling a decisive pivot towards sustainable growth. From having a nominal solar capacity a decade ago, China has surged to the vanguard of solar power production and utilization. By 2022, the country’s installed solar capacity stood towering at 393 GW—a colossal ascent from a paltry 1.0 GW in 2010. This rapid growth is reflective of China’s strategic emphasis on clean energy as a cornerstone of its national energy policy.
Economic and Environmental Impacts
The spectacular boom in China’s solar sector has triggered a wave of economic and environmental benefits. Serving as a major powerhouse for solar employment, the industry has created approximately 2.76 million jobs, primarily within the manufacturing sector. This phenomenal job creation, coupled with the country’s environmental commitments, illustrates how solar investments are fostering both a sustainable and economically buoyant future for China.
Comparative Growth in the EU and U.S.
European Union: Steady Increase in Solar Investments
In the European Union, the trajectory of solar capacity is marked by stable growth, buoyed by a resolve to adhere to the Paris Agreement’s climate objectives. As of 2022, solar installations in the EU have reached 205.5 GW, reflecting a steadfast climb in the deployment of solar technologies aimed at curbing greenhouse gas emissions and moving towards a more carbon-neutral economy.
United States: Solar Expansion and Employment
Not to be outdone, the U.S. displays a robust expansion in solar energy with its capacity reaching 113 GW. Solar investments have propelled job creation, with over 264,000 Americans working in the sector. This growth spurt in solar capacity aligns with a broader national goal to embrace clean energy and illustrates a commitment to both economic and environmental sustainability.
The Trajectory of Solar Energy Investments
Compound Annual Growth Rates (CAGR) Analysis
Breaking down the compound annual growth rates (CAGR) since 2017 reveals each region’s pace in solar energy investments. With a CAGR of approximately 25%, China is at the forefront, indicating a powerhouse in transition towards renewable energy. The U.S. follows suit with an impressive 21%, while the EU maintains a CAGR of 16%, each showcasing their resolve in augmenting solar capacity within their borders.
Projected Targets and Achievements
The discussion of solar targets brings into focus the strides made by these regions in meeting, and in some cases, surpassing, their solar installation goals. Most notable is China’s potential early completion of its 2030 wind and solar PV installation targets by 2024, six years in advance. This achievement is testament to the country’s unwavering commitment to renewable energy expansion.
Solar Industry’s Role in Job Creation
Employment Opportunities Across Regions
The solar industry’s impact on job creation spans all the examined regions. While China leads in numbers, the EU and U.S. are also significant contributors to the clean energy job market. The solar sector has not only played a role in advancing environmental agendas but has also been a vital engine for job creation in research, manufacturing, installation and maintenance.
Managing Interconnection Queues and Backlogs
Energy Project Queues in the United States
In the U.S., a critical look at interconnection queues reveals a significant backlog, with states like Texas, California, and Virginia amassing the highest numbers of projects waiting to join the grid. The average wait times range from 28 to 34 months, pointing to a pressing need for reforms that can address these bottlenecks efficiently.
Strategies for Reducing Wait Times
Effective strategies to reduce wait times for energy projects could include enhancing grid infrastructure, streamlining permit processes, and improving coordination between regulatory bodies. By tackling these issues, the U.S. might better harness the momentum of its growing solar sector and accelerate the transition to a renewable energy driven grid. As the global energy scene undergoes a significant transformation, placing solar energy at the heart of a renewable surge, the rapid expansion of solar PV systems in China, the EU, and the U.S. serves as a testament to this shift. Delving into these pivotal areas provides insight into the forces driving solar power to become a leader in the renewable energy movement.China leads the world in solar PV deployment, driven by government incentives and a strategic commitment to clean energy. The EU’s growth is spurred by policy frameworks and the aim to reduce carbon emissions. Likewise, in the U.S., falling costs, technological advancements, and supportive state policies contribute to solar energy’s rise.Overall, the increasing competitiveness of solar PV against traditional energy sources, coupled with an urgency to address climate change, is accelerating its adoption. These regions showcase the evolution of energy frameworks that prioritize sustainability, with solar power shining brightly as a sustainable and economically viable solution. Through this lens, it’s evident that solar energy is not just a trend, but a cornerstone of the future energy landscape.


